
Using AI to Diagnose Value Stream Performance
In our previous article, we highlighted the benefits of using the Supply Chain Operations Reference Digital Standard (SCOR DS), which is a model/framework that provides methodology, diagnostic and benchmarking tools for company value streams and supply chains.
In that article, we emphasized three complementary tools: SCOR, value stream mapping and ERP systems which enable a clear, mutual understanding of processes, metrics, metrics definitions and overall operational performance. Also, the SCOR model provides three levels of metrics (strategic, tactical and operational). These can be aligned with your organization’s tiered meeting cadence for effective review and decision-making..
What if we could harness Artificial Intelligence (AI) to automatically diagnose value stream performance and recommend targeted corrective actions?
Let’s explore a practical example using customer order fulfillment cycle time and its supporting hierarchy of strategic, tactical, and operational metrics.
We could query the AI engine with a targeted question such as:
“What percentage of our customer orders are fulfilled within our 12-week target, and what are the primary drivers of orders that exceed this timeframe?”
To answer this question, the AI would drill down into the supporting Level 2 metrics that drive the overall customer order fulfillment cycle time. Here are the key Level 2 metrics associated with it:
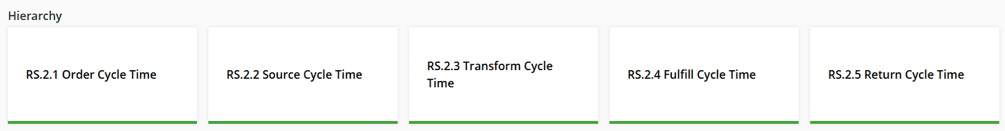
Assume AI returns the following analysis:
AI could then drill into the next level of the hierarchy:
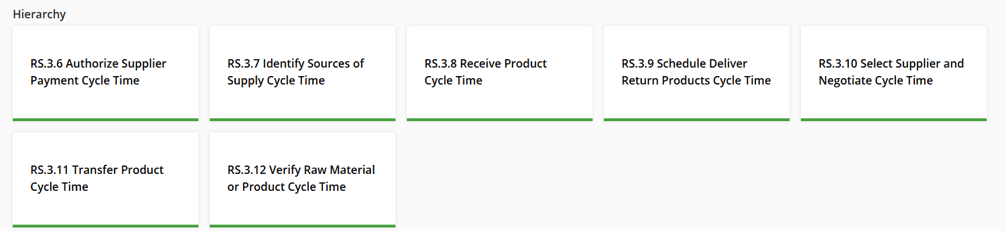
AI would return a more granular diagnosis such as:
AI would then review “receive product cycle time” and “identify sources of supply cycle time” metrics as follows:
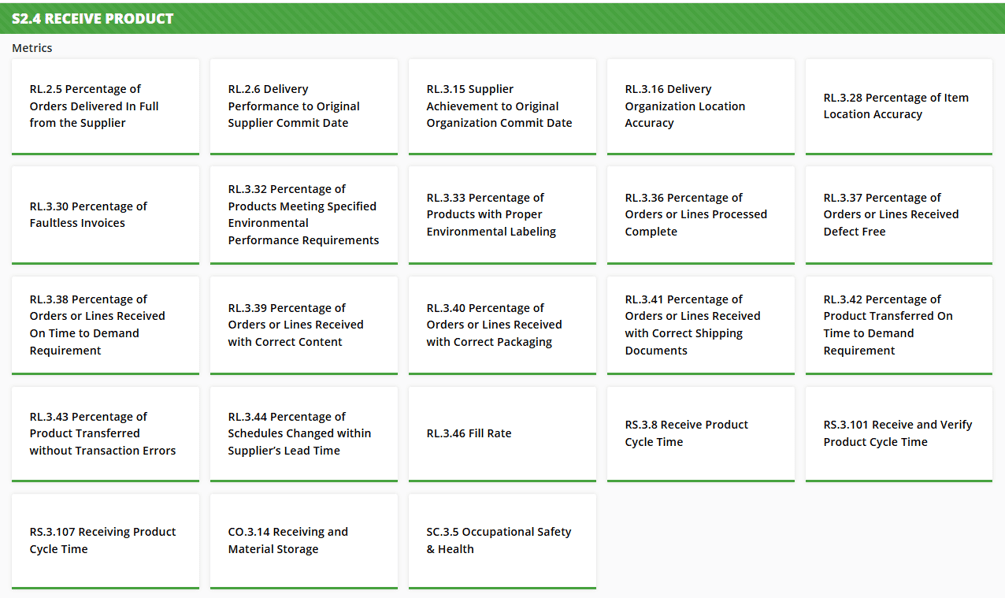
Based on this deeper hierarchy of metrics, the AI might generate the following clear, more actionable statements:
Putting it all together, the question asked:
“What percentage of our customer orders are fulfilled within our 12-week target, and what are the primary drivers of orders that exceed this timeframe?”
The AI enabled response:
This analysis immediately highlights where to focus improvement efforts. Suppliers X and Y are clear candidates for supplier development programs or the identification of alternate sources of supply. For Supplier Z, the data points to opportunities for improvement within its own internal processes. Assuming the necessary data infrastructure is in place, the AI can continue drilling into deeper layers of processes and practices to uncover the true root causes.
Here’s another practical example of an AI-powered query
Supplier A has reported a manufacturing issue and updated the lead time for part number PN #####-## to 15 weeks. What is the impact on our customer order fulfillment?
AI might respond with:
These examples are intentionally straightforward, focusing primarily on material-related delays. In practice, AI would typically identify multiple contributing causes across the entire value stream — both internal and supplier-facing.
Regardless, this article demonstrates the power of combining a structured framework like SCOR DS with AI. When comprehensive, well-organized data is available, AI could automatically analyze cause-and-effect relationships, provide diagnosis and recommend corrective actions to optimize operational value streams.